
Getting to Know You in Tableau
I’ve just finished Week 2 in the Duke course “Data Visualization and Communication with Tableau” (available online at Coursera).
This course is a great complement to the Tableau Desktop I: Fundamentals
course. The Tableau course teaches you the nitty-gritty of how to produce certain charts in Tableau. The Duke course also goes
over some of this, but also incorporates how to think about data and to think with data.
I had been wondering how to be able to communicate with stakeholders about data analysis plans
and how to stay organized while looking at a dataset. I now have a good framework, the ‘SPAP’,
for thinking about how to structure my approach. Here are the first and second course videos about SPAP.
Speaking of staying organized, there are a number of questions to ask and tasks to accomplish when you first start
working with a dataset. Here is checklist that I will be using going forward. I've included examples from working with a set of
data from Public Library Survey from the Institute of Museum and Library Services.
I'm starting with the dataset from Fiscal Year 2006 which contains survey
results from over 8900 public libraries in the United States.
- Got your data dictionary close by?
- After opening the data file, click on the 'Manage metadata' button.
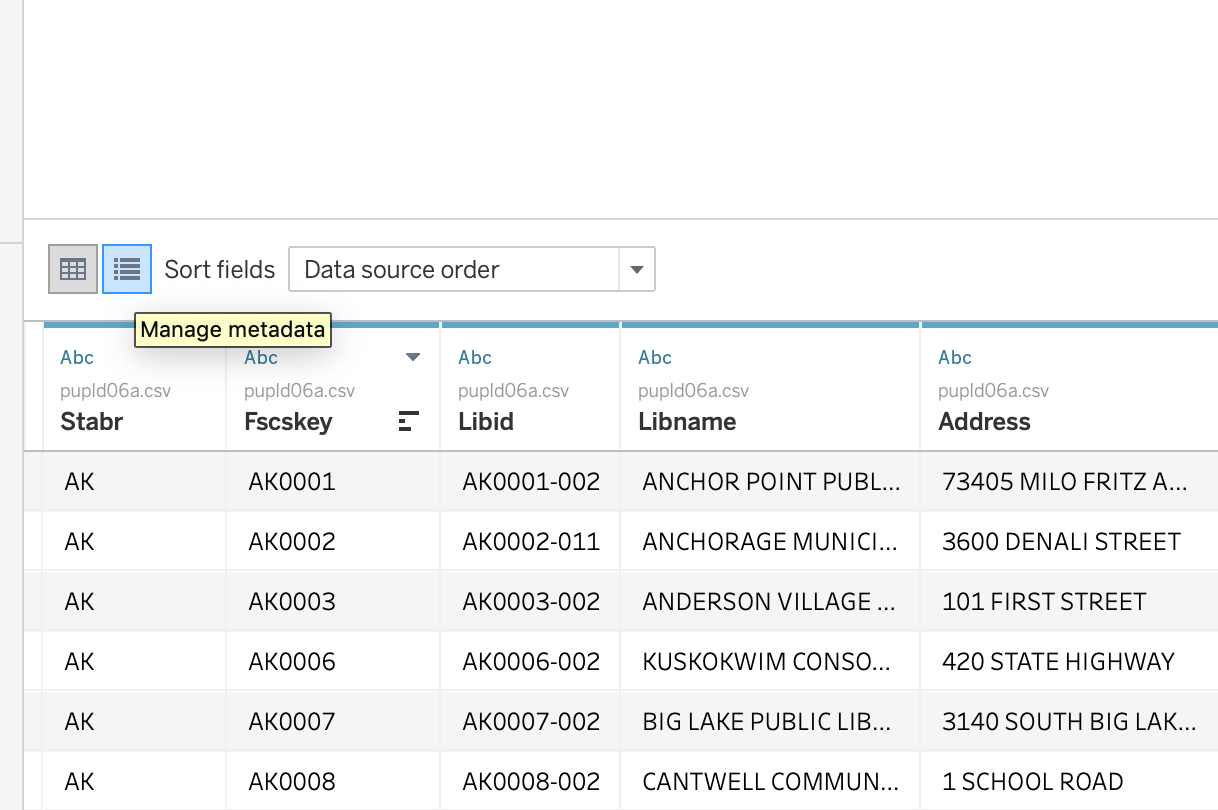
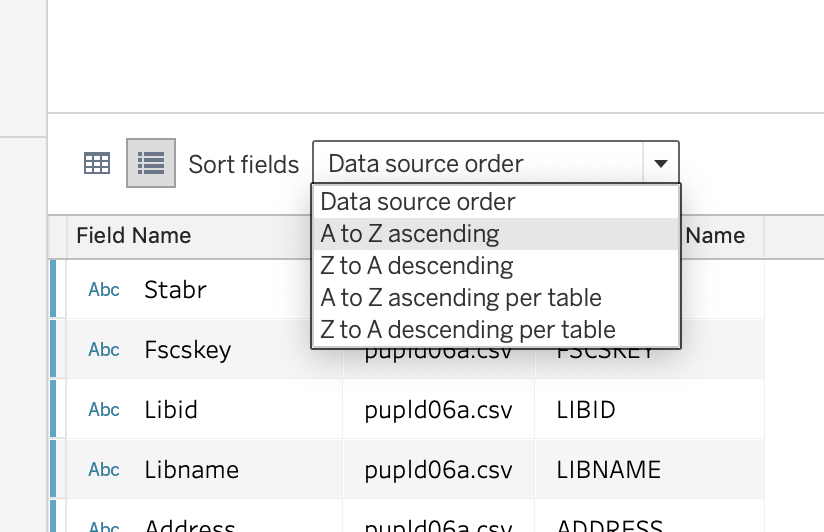
- Select 'Sort Fields: A to Z ascending'
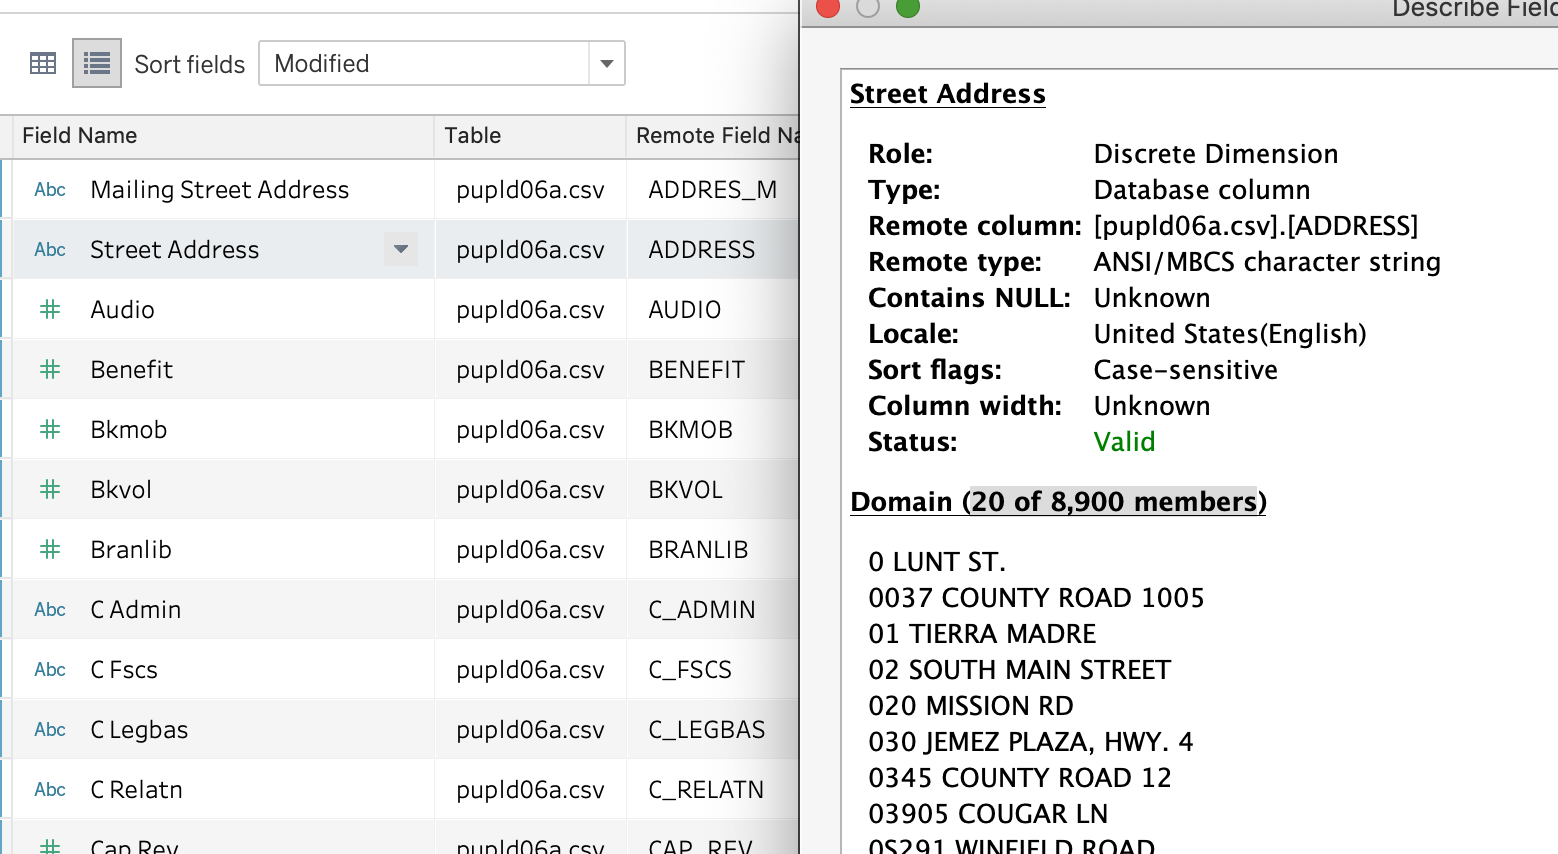
- Use Describe Data to get a peek at row counts and values. See image below.
- Using the data dictionary to guide you, rename fields to names that will be easily understood.
In the image below, you can see that I have renamed "ADDRES_M" to "Mailing Street Address" and "ADDRESS" to "Street Address."
- Check that Tableau has assigned measures and dimension status correctly. These are concepts deserving of their own blog post.
- Check that Tableau has assigned the correct data type (e.g., String, Number, Geolocation, etc).
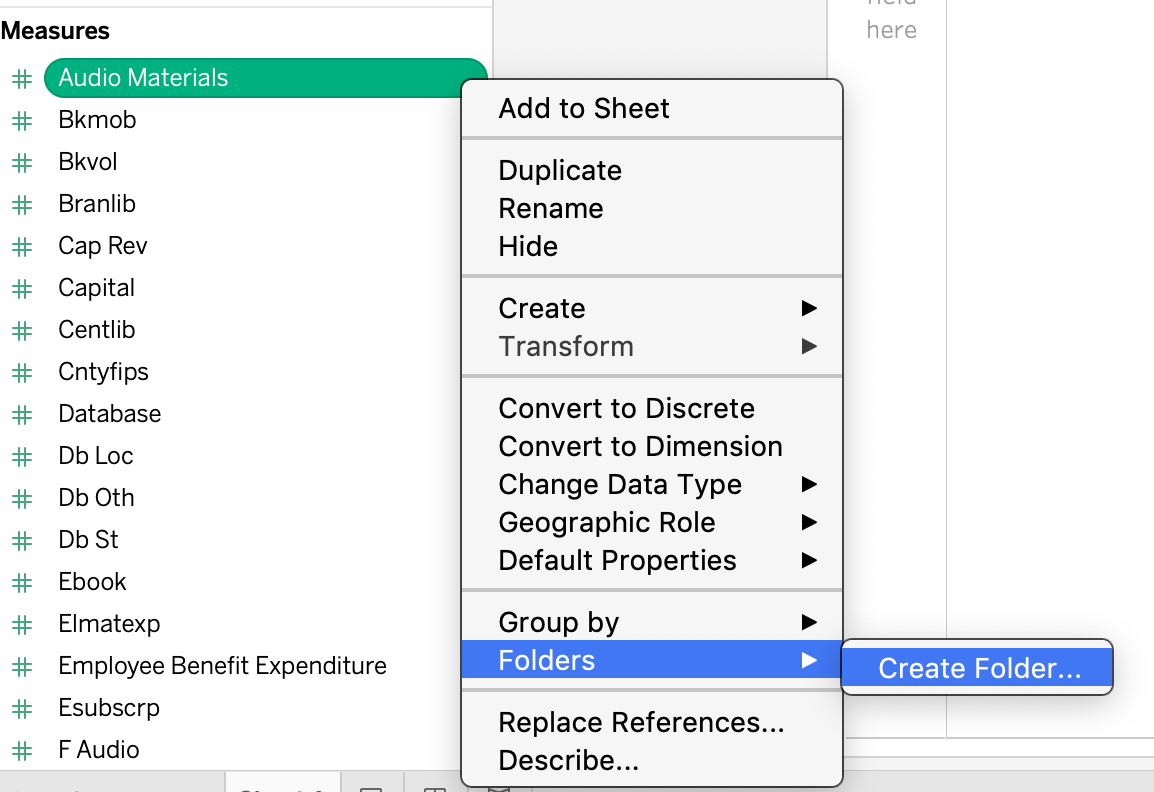
- Begin to organize the fields into folders.
- Open a worksheet.
- Right-click on field name.
- Select Group By... Folder
- Right-click again on field name.
- Select Folder... Create Folder
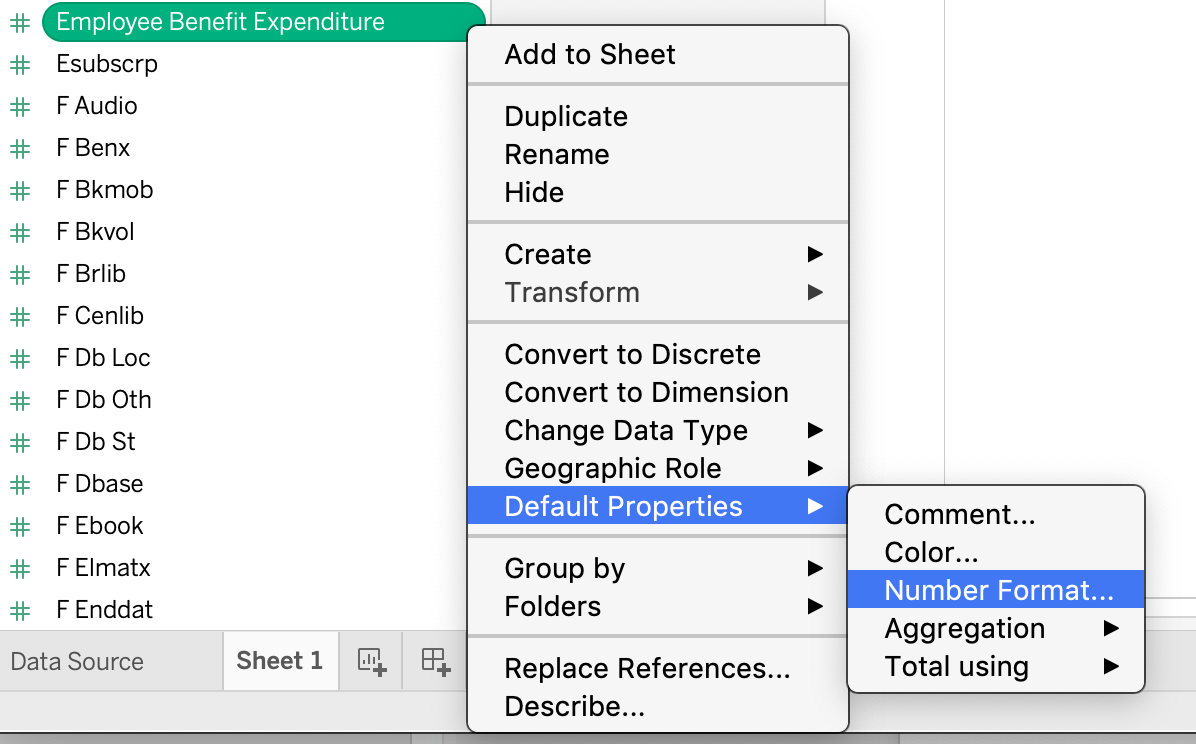
- Set the correct default formatting for the field. In a worksheet,
- Right-click on field name.
- Select Default Properties
- In this case change Number Format... to Currency.
With just an initial look at four fields, I've already generated 3 follow-up actions/questions.
- Do we need to keep Mailing Street Address?
- Tableau does not have ability to map street address. I'll be looking into fetching lat/lon values for the street addresses.
- Why do some number values have -1 values?
Looking Ahead
I'm wondering if you can leverage the Tableau data source file from one year to apply similiar formatting to other years of the Public Library Survey.
Summary
To summarize at a higher level, the initial steps of working with a dataset are:
- See what is in your data
- Switch obscure field names into ones with easily understood meaning
- Specify correct default formatting
- Sort into meaningful organization
- Scrutinize everything
- Seek answers
For me, this part of the data analysis is like being a detective. It is fun to begin to wrangle the data into something that will reveal the answers to questions. As I like to say, “More shall be revealed.”